

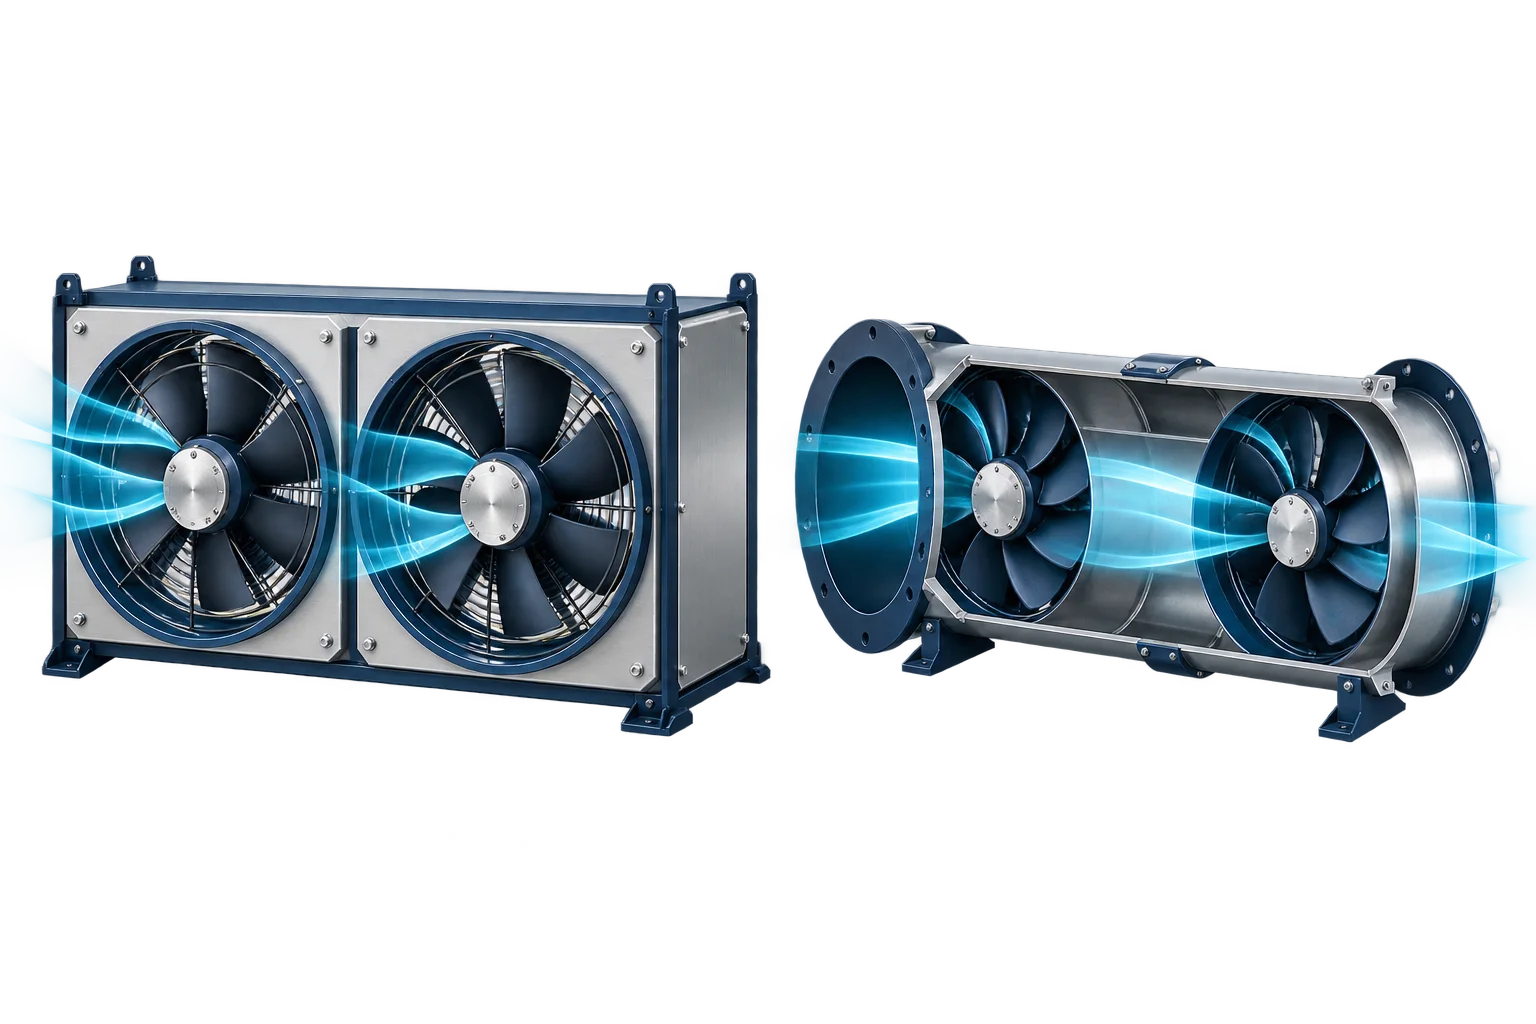
Adding a second fan seems like an easy way to improve ventilation performance. If one fan delivers 10,000 m³/h, two should deliver 20,000 m³/h. If one produces 500 Pa, two should produce 1,000 Pa.
Those assumptions describe specific points on ideal combined fan curves. They do not necessarily describe what happens after the fans are connected to a real duct system.
The actual result depends on the arrangement, the individual fan characteristics, the system resistance and the way the fans are controlled.
Understanding these relationships is essential when designing fan arrays, upgrading existing ventilation systems or providing standby capacity.
Fans in parallel vs series: the basic difference
Fans in parallel add airflow at the same pressure. Fans in series add pressure at the same airflow, assuming approximately constant air density and negligible interaction losses.
In a parallel arrangement, the air divides between separate fan branches and then combines. In a series arrangement, the air passes through one fan and then the next.
These are rules for constructing a combined characteristic. The final operating point still depends on the connected system (source: AMETEK Rotron — Series and Parallel Operations).
| Characteristic | Fans in parallel | Fans in series |
|---|---|---|
| Air path | Separate branches between common pressure regions | Successive fans in the same air path |
| How the ideal curve is constructed | Add airflow at equal pressure | Add pressure at equal airflow |
| Typical reason for use | Higher airflow, modular capacity, redundancy | Higher pressure capability |
| Main selection concern | Flow sharing and stable operation | Stage matching and interstage conditions |
| If one fan stops | Its branch may allow reverse flow | The stopped fan becomes a restriction |
| Installation factors | Plenum geometry, branch losses, isolation | Connecting ductwork, swirl, density changes |
Physical position alone does not determine the arrangement. Two fans next to each other are only operating in parallel if their airflow paths connect the relevant common pressure regions.
How to construct a parallel fan curve
For fans connected in parallel, add the airflow of each fan at a common pressure:
Qparallel(Δp) = Q1(Δp) + Q2(Δp)
For N identical fans operating at the same speed under equivalent conditions:
Qparallel(Δp) = N · Qsingle(Δp)
Imagine that each fan can deliver 5,000 m³/h at 600 Pa. Two identical fans can ideally deliver a combined 10,000 m³/h at that same pressure.
However, the connected system must also require 600 Pa at 10,000 m³/h for that to become the actual operating point.
An illustrative curve combination looks like this:
| Pressure | One fan | Two identical fans in parallel |
|---|---|---|
| 800 Pa | 0 m³/h | 0 m³/h |
| 700 Pa | 3,536 m³/h | 7,071 m³/h |
| 600 Pa | 5,000 m³/h | 10,000 m³/h |
| 400 Pa | 7,071 m³/h | 14,142 m³/h |
| 200 Pa | 8,660 m³/h | 17,321 m³/h |
| 0 Pa | 10,000 m³/h | 20,000 m³/h |
These values come from a simplified mathematical curve used for this article. They are not manufacturer test data, and the endpoints are not recommended operating conditions.
On a graph, the parallel curve stretches horizontally. The ideal shutoff pressure remains unchanged.
How to construct a series fan curve
For fans operating in series at approximately constant density, add their total pressure rises at the same airflow:
Δpt,series(Q) = Δpt,1(Q) + Δpt,2(Q)
Two identical fans that each generate 600 Pa at 5,000 m³/h would ideally generate 1,200 Pa together at that flow.
The pressure available across the installed assembly is reduced by connecting losses:
Δpt,assembly = Δpt,1 + Δpt,2 − Δpt,connection
Use total pressure consistently for this balance. Adding catalogue fan static pressures without accounting for velocity pressure and reference planes can give an incorrect result.
Strictly, successive fans handle the same mass flow if there is no leakage. Their inlet volumetric flows can differ because pressure and temperature change between stages:
ṁ = ρ1 · Q1 = ρ2 · Q2
The constant-density approximation is useful for explaining low-pressure ventilation systems. Higher pressure rises or significant heating require a more detailed stage calculation (source: Greenheck — Multiple Fan Systems).
Why the system curve changes the result
A fan does not deliver one fixed airflow regardless of the installation.
The operating point lies where the fan pressure curve intersects the system pressure requirement.
For a simple system dominated by turbulent resistance:
Δpsystem = K · Q²
Here, K represents the system resistance for the chosen airflow units.
In this simplified system, doubling airflow requires four times the pressure. That is why doubling the available fan airflow at a fixed pressure does not automatically double the flow through an existing duct network.
Some systems also have a fixed pressure requirement or components that do not follow a purely quadratic relationship. A more general approximation is:
Δpsystem = Δp0 + a · Q + b · Q²
The appropriate model depends on the components and operating conditions (source: AMCA — Fan and System Curves with Fan Energy Index).
Worked example: one fan, two in parallel and two in series
Consider the following illustrative single-fan curve:
Δpf = 800 − 8 · q²
where:
Δpfis total pressure rise in Pa.qis airflow through one fan in thousands of m³/h.
Assume the connected system has this resistance curve:
Δpsystem = 8 · Q²
where Q is total system airflow, also in thousands of m³/h.
All fans run at the same fixed speed. Density is constant, and additional branch and connection losses are ignored.
One fan
For one fan, q = Q. At the operating point:
800 − 8 · Q² = 8 · Q²
Therefore:
Q = √50 = 7.071
The single fan delivers approximately:
- Airflow: 7,071 m³/h
- Pressure: 400 Pa
Two identical fans in parallel
Each fan carries half the total flow:
q = Q / 2
The combined curve becomes:
Δpparallel = 800 − 8 · (Q / 2)² = 800 − 2 · Q²
Intersecting this with the unchanged system curve:
800 − 2 · Q² = 8 · Q²
Q = √80 = 8.944
The result is:
- Total airflow: 8,944 m³/h
- Airflow per fan: 4,472 m³/h
- Pressure: 640 Pa
Adding the second fan increases airflow by approximately 26.5%, not 100%.
Each fan moves less air than the original single fan because both now operate against a higher pressure.
Two identical fans in series
Both fans handle approximately the same airflow. Their pressure rises add:
Δpseries = 2 · (800 − 8 · Q²) = 1600 − 16 · Q²
At the new operating point:
1600 − 16 · Q² = 8 · Q²
Q = √(1600 / 24) = 8.165
The result is:
- System airflow: 8,165 m³/h
- Combined pressure: 533 Pa
- Pressure rise per fan: approximately 267 Pa
The system pressure does not double from 400 to 800 Pa because the airflow increases, moving both fans to a different point on their individual curves.
| Arrangement | System airflow | System pressure | Airflow increase |
|---|---|---|---|
| One fan | 7,071 m³/h | 400 Pa | — |
| Two fans in parallel | 8,944 m³/h | 640 Pa | 26.5% |
| Two fans in series | 8,165 m³/h | 533 Pa | 15.5% |
These results apply to this particular fan curve and system curve. They are not universal performance multipliers.
How system resistance affects the best arrangement
The same illustrative fan curve can be used to compare systems with different resistance coefficients.
Repeating the calculation for three values of K gives:
| System resistance coefficient* | One fan | Two in parallel | Two in series |
|---|---|---|---|
K = 2 | 8,944 m³/h | 14,142 m³/h | 9,428 m³/h |
K = 8 | 7,071 m³/h | 8,944 m³/h | 8,165 m³/h |
K = 32 | 4,472 m³/h | 4,851 m³/h | 5,774 m³/h |
* K is expressed in Pa/(1,000 m³/h)² for this example.
In the lower-resistance system, parallel operation produces the larger airflow increase. In the higher-resistance system, series operation produces the larger increase.
This comparison illustrates why the correct question is:
Which combined fan curve intersects my system curve at the required duty point?
A configuration should then be checked against real fan operating limits, power curves and installation conditions.
What happens when one parallel fan stops?
A stopped fan does not automatically close its airflow path.
If its branch remains open, pressure in the discharge plenum can drive air backwards through the inactive fan. Some air may circulate through the inactive branch instead of reaching the downstream system.
The design therefore needs to address branch isolation, damper leakage and the resistance of the remaining active paths. A stopped series fan presents a different problem: it remains directly in the flow path and adds resistance (source: U.S. Department of Energy — Improving Fan System Performance).
The earlier numerical example also shows why losing one of two parallel fans does not necessarily halve system airflow.
With both fans running, Q = 8,944 m³/h. With one fan running and the inactive branch ideally isolated, Q = 7,071 m³/h.
The remaining fan supplies approximately 79% of the two-fan airflow in this simplified system.
However, the pressure falls from 640 Pa to 400 Pa. The remaining fan also moves from 4,472 to 7,071 m³/h on its own curve.
Its power, efficiency and operating limits must therefore be checked at that new point. They cannot be inferred from the original two-fan duty.
Why four fans do not automatically provide N+1 redundancy
Consider an array required to deliver Qdesign = 24,000 m³/h at Δpdesign = 800 Pa.
With four identical fans operating, each carries:
Qfan = 24,000 / 4 = 6,000 m³/h
If the design requires the same duty after one fan fails, each of the three remaining fans must deliver:
Qfan,failure = 24,000 / 3 = 8,000 m³/h
That means each remaining fan must deliver 8,000 m³/h at the required pressure, allowing for the actual assembly losses.
The available curve must support that point within speed, motor power and operating limits.
A four-fan array selected only for 6,000 m³/h per fan at maximum speed may have no reserve capacity.
For an N+1 requirement, specify the failure duty explicitly:
- Must full design airflow be maintained?
- Is reduced emergency airflow acceptable?
- What pressure must be maintained?
- What speed and power are available after a failure?
- How is the inactive branch isolated?
Redundancy is a verified operating condition, not simply a fan count.
Stable operation and unequal flow sharing
The simple parallel calculation assumes that each fan has a stable, well-defined airflow at the common pressure.
Real fan curves can contain peaks and unstable regions. Avoid selecting only by the combined curve without checking the individual operating points. AMCA identifies operation near or to the left of peak pressure as a potential stability concern; the manufacturer’s permitted operating range should govern the selection (source: AMCA — Straightening Out Fan Curves).
Parallel fans can also experience unequal loading. Greenheck specifically cautions against selections where the operating range allows hunting and unequal flow sharing (source: Greenheck — Multiple Fan Systems).
Check the array at more than one condition:
| Operating condition | What to verify |
|---|---|
| All fans at design duty | Required flow, pressure and individual operating points |
| Minimum demand | Stable operation at reduced speed or reduced fan count |
| One fan unavailable | Remaining capacity, branch isolation and motor loading |
| Increased system resistance | Operation with dirty filters or changed damper positions |
| Fan staging transition | Pressure control and smooth load transfer |
Different fan models can sometimes operate in parallel, but equal flow sharing should not be assumed. Each branch needs to be evaluated at the common pressure, including its own losses.
Installation geometry can reduce the expected performance
An ideal combined curve assumes suitable airflow conditions at every fan.
Restricted inlets, uneven approach flow, swirl, nearby obstructions and poorly arranged outlet ductwork can reduce installed performance. These effects are commonly described as system effect.
A compact array should therefore be reviewed for inlet clearance, wall proximity, partitions, plenum geometry and accessories. A closely coupled series arrangement also needs careful assessment of the airflow entering the second stage (source: AMCA — Mitigating System Effect).
For preliminary array assessment, the CloudAir Fan Array Calculator combines single-fan duty data with array layout and clearance inputs.
A duty-point calculation has a specific limitation: without the complete fan curve, an additional pressure penalty cannot determine the exact resulting airflow. The corrected operating point requires the fan and system characteristics.
One large fan or several smaller fans?
Both options should be compared at the same required system duty and across the expected operating schedule.
| Criterion | One large fan | Several smaller fans |
|---|---|---|
| Design-point efficiency | Depends on the selected fan and duty | Depends on each fan’s duty and assembly losses |
| Part-load operation | Can use variable-speed control | Can combine speed control and fan staging |
| Failure response | A single fan failure can stop airflow | Partial capacity may remain |
| Maintenance | Fewer components | More components, but smaller individual modules |
| Replacement access | May require larger access routes | Smaller units may simplify handling |
| Controls | Usually simpler | Requires coordination and failure handling |
| Acoustics | One source with its own spectrum | Multiple sources and operating combinations |
An array is not automatically more efficient, and a single fan is not automatically the lowest-cost solution.
A useful comparison includes actual electrical input at several load points, annual operating hours, maintenance requirements and the value of retained capacity after a failure.
Illustrative energy comparison
Suppose two candidate solutions meet the same duty, but their total electrical inputs at that condition are:
- Solution A: 8.0 kW.
- Solution B: 9.2 kW.
If that condition occurs for 4,000 hours annually:
ΔE = (9.2 − 8.0) × 4,000 = 4,800 kWh/year
At an assumed electricity price of €0.20/kWh:
ΔC = 4,800 × 0.20 = €960/year
This calculation does not favour either arrangement. It shows why the comparison should use measured or predicted electrical input at the required duty.
For variable demand, repeat the calculation for each operating period:
Eannual = Σj Pelectrical,j · tj
Fan array noise: why decibels cannot be added directly
Multiple fans introduce multiple sound sources.
For independent sources whose sound powers can be combined, the total sound power level is:
LW,total = 10 · log₁₀( Σi=1…N 10LW,i/10 )
For equal sources:
LW,total = LW,single + 10 · log₁₀(N)
This gives the following arithmetic increases:
| Number of equal independent sources | Increase over one source |
|---|---|
| 2 | 3.0 dB |
| 3 | 4.8 dB |
| 4 | 6.0 dB |
| 8 | 9.0 dB |
Four fans producing 75 dB sound power each would therefore have a combined sound power level of approximately 81 dB, under these assumptions.
That does not mean an array is always louder than a single larger fan. The individual sound levels, operating speeds and spectra can be different.
Sound pressure at a receiver also depends on distance, directivity, attenuation and the room. For a receiver calculation, combine the sound pressure contributions evaluated at that same receiver; do not mix sound power and sound pressure values.
Use the CloudAir Sound Source Summation Calculator to explore logarithmic addition of source contributions.
Common selection mistakes
| Mistake | Better approach |
|---|---|
| Adding the original single-fan operating flows | Construct the combined curve and find its intersection with the system curve |
| Assuming parallel fans increase shutoff pressure | Add airflow at equal pressure |
| Assuming series fans double the original operating pressure | Recalculate the operating point after adding the second stage |
| Mixing static and total pressure ratings | Use consistent pressure definitions and reference planes |
| Treating motor nameplate power as actual consumption | Use electrical input at the evaluated operating point |
| Assuming identical fans always share flow equally | Check branch losses, speed, inlet conditions and stability |
| Assuming an inactive fan blocks airflow | Assess isolation and leakage |
| Calling any multi-fan array N+1 | Verify the required duty with one fan unavailable |
| Selecting only for the clean-filter design condition | Check the complete expected resistance range |
| Ignoring assembly losses | Include the actual plenum, duct and accessory arrangement |
A practical selection workflow
- Define the system duty. Establish airflow, pressure basis, air density and the range of operating conditions.
- Obtain complete fan data. Include pressure, power, efficiency, speed limits and permitted operating regions.
- Construct the combined curve. Add flows at equal pressure for parallel operation or total pressure rises at equal flow for series operation.
- Account for installation conditions. Include branch and connection losses and assess system effect.
- Find the operating points. Evaluate design, part-load and increased-resistance conditions.
- Check failure operation. Verify remaining capacity, isolation, speed and motor loading.
- Compare annual energy and acoustics. Evaluate the expected operating schedule.
- Confirm the installed arrangement. Review the selection with the manufacturer using the actual geometry and controls.
For related duty-point calculations, explore the CloudAir Fan Operating Point Calculator.
Frequently asked questions
Do two fans in parallel double airflow?
They double the ideal airflow available at a given pressure when the fans are identical and operate under equivalent conditions. The flow through an existing installation must still be calculated from the system curve.
Do two fans in series double pressure?
They ideally double pressure rise at a given airflow under constant-density assumptions. The actual installation usually moves to a new operating point, and connecting losses reduce the available pressure.
Can a fan array operate with one fan switched off?
Potentially, provided the inactive branch, remaining fan operating points and control response have been assessed. Continued operation does not necessarily mean full design capacity remains available.
Can different fans operate in parallel?
Sometimes. Their individual characteristics and branch losses must be evaluated at the common pressure. Different fans should not be assumed to share the airflow equally.
Is a fan array always more energy efficient?
No. Compare electrical input at the required duty and over the annual load profile. Efficiency depends on selection, controls and installation losses.
What should I check before adding a second fan?
Obtain the existing fan curve and establish the system resistance. Then calculate the proposed combined operating point and check power, stable operation, installation geometry and failure behaviour.
The same principle applies when selecting from a whole product range: our fan selection software checks each model’s performance curve against the required duty point and can evaluate several operating scenarios for the same fan side by side.