
A fan catalogue says 65 dB. Will the fan be quiet enough for your project?
Before you can answer, you need to know what that number describes: sound power or sound pressure, weighted or unweighted, at which operating point, and for which side of the fan. If it is sound pressure, you also need the receiver distance and the acoustic conditions it was quoted under.
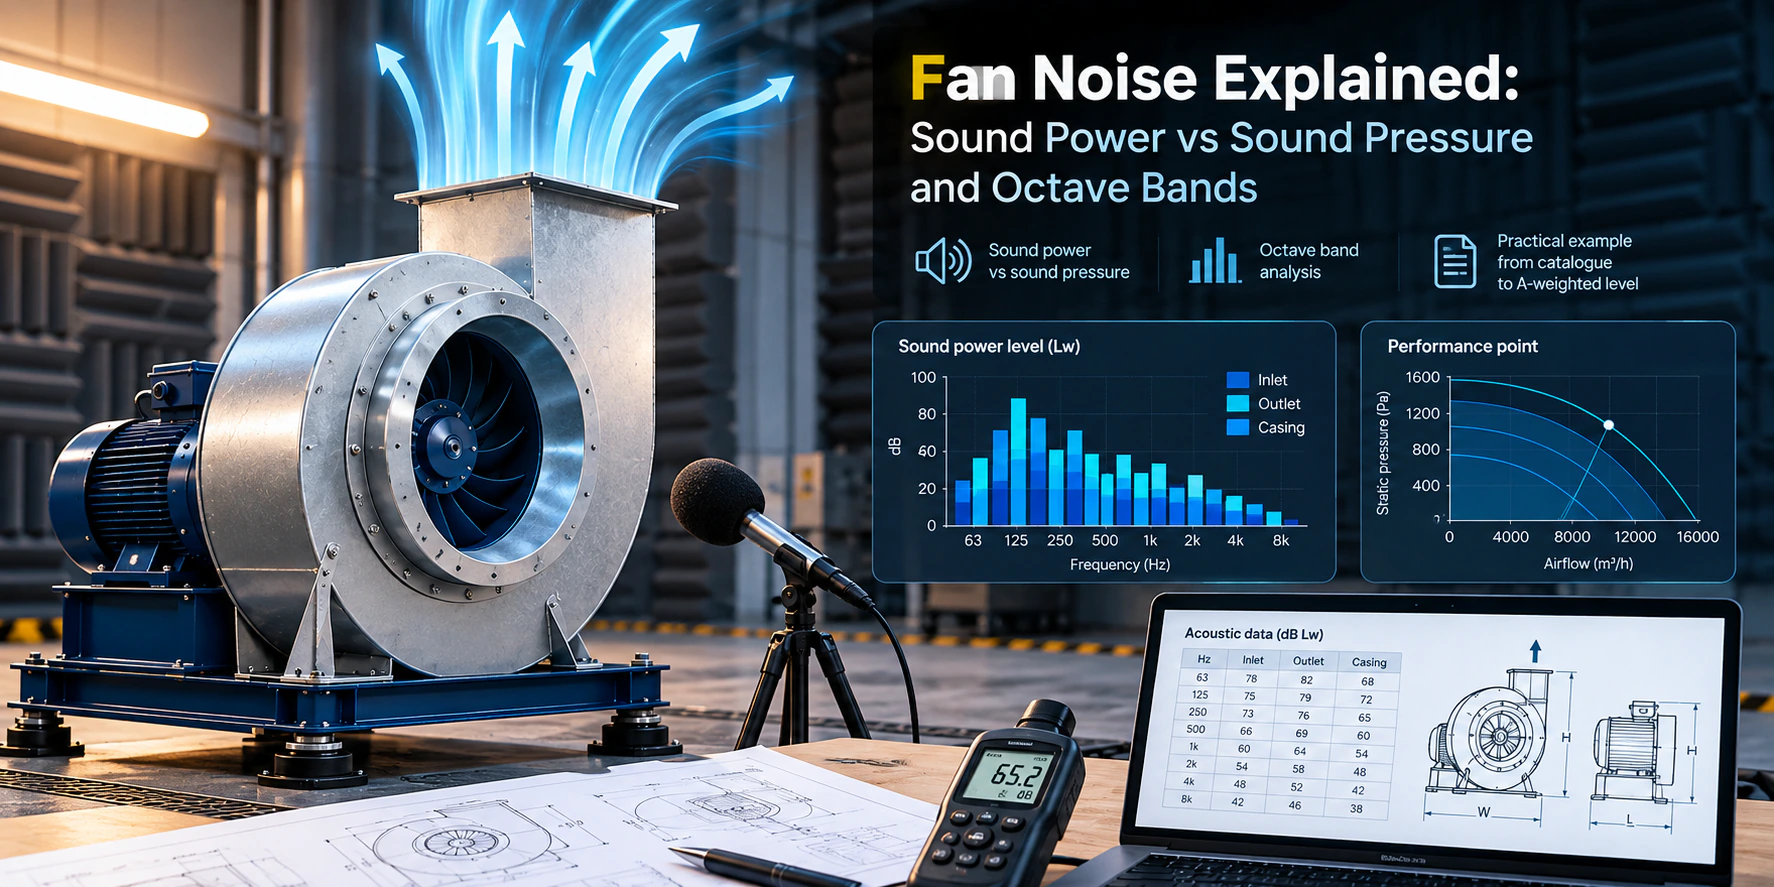
This guide takes a sample fan spectrum through the whole calculation: from octave-band sound power to an A-weighted total, then to an estimated sound pressure level at a receiver. It also covers what changes when you add a second fan or fit a silencer.
Sound power and sound pressure describe different things
Sound power is the acoustic energy emitted per unit time. Its level, Lw, describes the source under stated operating and installation conditions.
Sound pressure is the local pressure fluctuation caused by sound. Its level, Lp, describes the sound field at a particular position.
| Sound power level | Sound pressure level | |
|---|---|---|
| Symbol | Lw | Lp |
| Reference | 10⁻¹² W | 20 μPa in air |
| Main use | Describe source emission | Describe sound at a receiver |
| Does moving the microphone change it? | No, for an unchanged source | Generally, yes |
| Essential context | Duty point, configuration, radiation path | Source data, distance, direction, environment |
Both levels use decibels, but they have different reference quantities. A microphone reading taken beside an installed fan cannot be compared directly with a catalogue sound power level.
For example, LwA = 82 dB and LpA = 65 dB at 3 m could describe the same source. The worked example below shows how.
The A in dB(A) does not mean sound pressure
A-weighting applies frequency-dependent corrections that reduce the contribution of low frequencies and adjust other bands. It is a standardised way to form a useful overall rating, not a complete description of perceived sound quality.
Both sound power and sound pressure can be A-weighted: write LwA for sound power and LpA for sound pressure. Writing only "dB(A)" leaves that distinction unresolved.
An overall A-weighted level also hides how sound is distributed across frequencies. Keep the spectrum alongside the total, particularly where low-frequency noise matters.
What octave bands tell you
Common fan sound data use eight nominal octave-band centre frequencies: 63, 125, 250, 500, 1,000, 2,000, 4,000 and 8,000 Hz.
Each value represents sound energy over a frequency range, not a measurement at one exact frequency. In an octave band, the upper and lower band-edge frequencies have a ratio of two, and adjacent nominal centre frequencies approximately double.
Request separate inlet and outlet spectra. Where noise reaching neighbouring spaces through the fan body matters, request casing-radiated data too. These are different radiation paths and should not be substituted for one another.
Worked example: from a spectrum to LwA
Consider the following illustrative, synthetic spectrum for one radiating source. It is not a measured product rating, and it is not the output of a VDI 3731 calculation.
The A-weighting corrections below use the conventional rounded values at the nominal band centres. This is an octave-band approximation; a detailed measured spectrum can give a different weighted total when strong tones lie within a band.
| Octave-band centre, Hz | Lw, dB | A correction, dB | Weighted band contribution, dB |
|---|---|---|---|
| 63 | 82.0 | −26.2 | 55.8 |
| 125 | 85.0 | −16.1 | 68.9 |
| 250 | 84.0 | −8.6 | 75.4 |
| 500 | 80.0 | −3.2 | 76.8 |
| 1,000 | 76.0 | 0.0 | 76.0 |
| 2,000 | 72.0 | +1.2 | 73.2 |
| 4,000 | 68.0 | +1.0 | 69.0 |
| 8,000 | 62.0 | −1.1 | 60.9 |
First add the correction to each band, then combine the weighted contributions logarithmically:
LwA = 10 · log₁₀( Σ 10(Lw,i + Ai)/10 )
For these inputs, the unweighted total across the eight bands is Lw = 89.5 dB, and the A-weighted total is LwA = 82.1 dB.
The 7.4 dB difference belongs to this particular spectrum. It is not a general conversion factor between dB and dB(A).
Notice that 125 Hz has the highest unweighted level, while 500 Hz makes the largest weighted contribution. Keeping both views is what tells you which frequency actually needs attention — a single total cannot.
From sound power to sound pressure at a distance
For an ideal compact source in its far field, a useful screening model is:
Lp ≈ Lw + 10 · log₁₀( Qd / (4π r²) )
Here r is the distance from the source's acoustic centre in metres, and Qd is the directivity factor — not volume airflow. The expression assumes ordinary air conditions and neglects atmospheric attenuation, barriers and room reverberation. Qd = 1 represents ideal spherical radiation; Qd = 2 represents ideal hemispherical radiation above a reflecting plane.
Applying it to the example spectrum with these explicit assumptions:
- One equivalent compact source, with the listed spectrum representing its radiated sound power.
- Receiver at 3 m, assumed to be in the far field.
- Ideal reflecting plane,
Qd = 2in every band. - No ducts, barriers, additional sources or reverberant contribution.
The geometric correction is 10 · log₁₀( 2 / (4π × 3²) ) = −17.52 dB, so:
LpA ≈ 82.06 − 17.52 = 64.5 dB(A)
This is an illustrative propagation estimate, not a guaranteed level beside a real fan. In particular, an in-duct outlet sound power spectrum needs a duct and outlet-radiation model before it can be used to predict a level outdoors.
When does doubling distance reduce sound by 6 dB?
Applying the same point-source model to LwA = 90 dB with Qd = 2 gives:
| Distance | Calculated LpA |
|---|---|
| 1 m | 82.0 dB(A) |
| 2 m | 76.0 dB(A) |
| 4 m | 70.0 dB(A) |
| 8 m | 64.0 dB(A) |
The decrease is approximately 6 dB per doubling within this model. Its geometry must remain applicable, and the receiver must be in the far field — the table does not establish that 1 m is far enough from any particular fan.
An occupied room requires a source–path–receiver calculation that accounts for transmission through the system and for the receiving space itself. Distance alone does not describe the result.
Why octave bands matter when selecting a silencer
A silencer's insertion loss varies with frequency. Apply the appropriate band losses to the sound transmitted along that path, and include the silencer's own flow-generated noise where relevant. A single advertised attenuation figure cannot replace that calculation.
For an illustrative single-band calculation, assume sound power entering the silencer of 80 dB, applicable insertion loss of 20 dB, and silencer-generated downstream sound power in that band of 58 dB. The transmitted component is 60 dB, and combining it with the generated component gives:
10 · log₁₀( 1060/10 + 1058/10 ) = 62.1 dB
The result is 62.1 dB, not 60 dB. Repeat the calculation for every band using compatible manufacturer data and the actual flow conditions.
Then evaluate the other paths separately: an outlet silencer does not automatically resolve inlet noise, casing radiation or structure-borne transmission.
Two fans do not mean twice the decibel level
For independent, uncorrelated sources, combine their contributions logarithmically. Two equal contributions of 65 dB(A) at the same receiver produce 68.0 dB(A). Four equal contributions produce 71.0 dB(A).
These are calculated equal-contribution examples, not predictions for a particular fan array. In an actual array, determine each fan's duty point, source spectrum and propagation path first — different distances and operating conditions change the contributions.
Listen for tones as well as broadband noise
A useful frequency to check is the blade-passing frequency, where z is the blade count and n the rotational speed in rpm:
fBPF = z · n / 60
With nine blades at 1,450 rpm, the calculated blade-passing frequency is 217.5 Hz, which falls within the nominal 250 Hz octave band. Blade count and speed identify a frequency of interest; they do not determine the tone's amplitude.
Octave-band data are useful for design, but investigating a distinct tonal complaint may require finer frequency resolution. Do not assume that two similar overall dB(A) totals describe the same sound.
Compare fans at the operating conditions you will actually use
Ask for sound data at the required airflow and pressure, then assess the operating range. Choosing an appropriate operating point and avoiding unstable operation are part of acoustic design; speed and control strategy matter too. The same reasoning that drives the choice between an axial and a centrifugal fan applies here — the quieter machine is usually the one running closer to its best efficiency point, not the one with the lower headline figure.
It is also worth confirming that the installation will deliver the duty the sound data assumes. A fan forced off its intended operating point by system effect or poor inlet conditions will not produce the spectrum you selected it on; our guide to a fan not delivering its expected airflow covers the usual causes.
For each candidate, request:
- Airflow, pressure basis, speed and configuration associated with the sound data.
- Inlet and outlet octave-band sound power, plus casing data when relevant.
- Clear identification of whether the figure is Lw, LwA, Lp or LpA.
- The acoustic test or rating method, and whether the result is measured, derived from test data, or estimated.
- Distance, direction and environmental assumptions behind any quoted Lp value.
AMCA 300 addresses reverberant-room fan sound testing, AMCA 301 addresses calculation of sound ratings from laboratory data, and AMCA 320 uses sound intensity. These are acoustic methods, distinct from an aerodynamic performance test.
Use calculations at the right stage
When measured data are unavailable, the fan acoustic calculator estimates fan sound power and octave-band spectra using its VDI 3731 method. Use it for preliminary screening, with the model assumptions visible. An estimate does not replace a measured product spectrum.
For several sources, the sound source summation calculator estimates their combined level at one receiver from source power, distance and directivity. Its simplified model does not include room reverberation or barriers.
Start with the spectrum, follow the sound paths, and evaluate the result at the receiver. That gives a far more useful selection basis than one unexplained decibel figure.
Frequently asked questions
Can I compare 70 dB LwA with 60 dB LpA?
Not directly. One describes source emission; the other describes sound at a position under stated conditions. Convert the sound power level to a sound pressure level at the same position and under the same assumptions before comparing.
Can I convert dB to dB(A) by subtracting a fixed number?
No. The correction depends on the frequency spectrum. In the worked example above the difference is 7.4 dB, but that value belongs to that spectrum alone.
Is the highest octave band the overall level?
No. The overall level is a logarithmic sum over the included bands. For LwA or LpA, apply the frequency weighting first, then sum.
Can an outlet silencer solve all fan noise?
No. Inlet, outlet, casing-radiated and structure-borne paths each need separate consideration. Attenuating one path leaves the others unchanged.
What does dB(A) actually measure?
It is a single-figure rating formed by applying standardised frequency corrections before summing the bands. It can describe either sound power or sound pressure, so the symbol matters: LwA and LpA are not interchangeable.
If you would rather have octave-band data attached to every selection than chase it per enquiry, that is exactly what our fan selection software puts in front of your customers — spectrum, operating point and compliance figures generated from the same product record.