
Qmax has changed for 120 models.
Someone corrects a column in the master spreadsheet. The PDF catalogue still carries the old figure, because reissuing it means going back to the designer. The website shows a third value, entered by hand eighteen months ago. The selection program reads its own export, which nobody has regenerated. Four numbers, one fan, and no way to tell from the outside which one a customer is quoting back at you.
The instinct is to blame the spreadsheet. But a manufacturer with 5,000 fans does not have a file problem — it has a modelling problem. The data was never given a structure that could survive being changed.
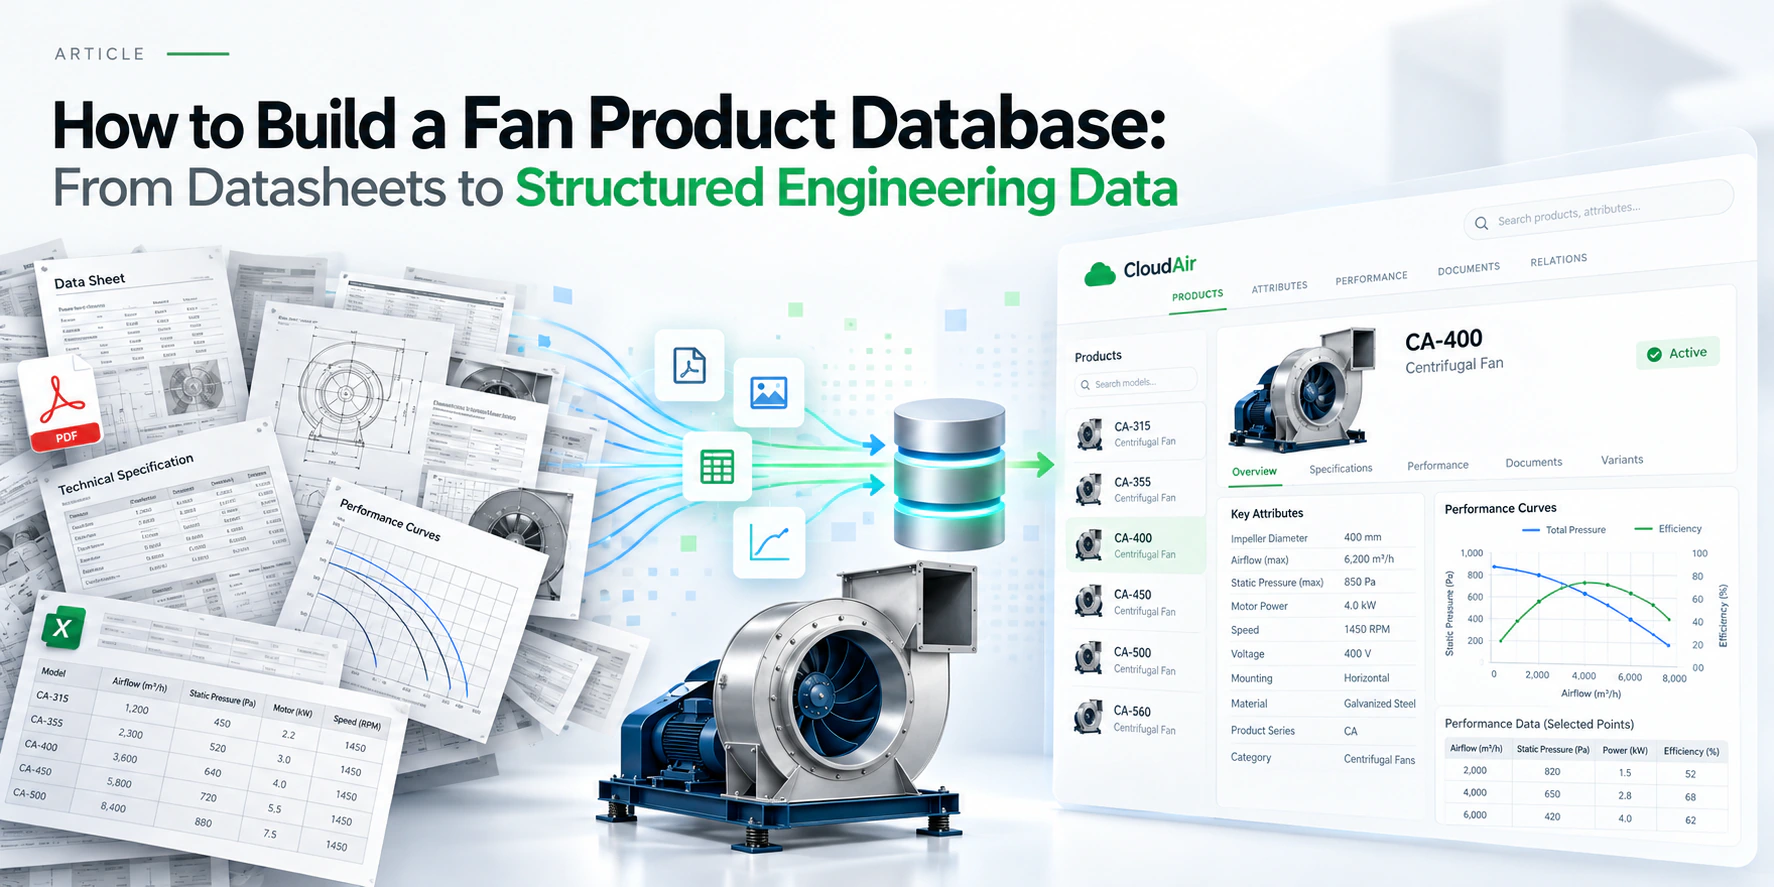
This article is about that structure: how to lay out a fan product database so a single edit lands everywhere, and so the data can still be used by a calculation engine years later. It is the schema-level companion to our broader piece on why product data belongs in one system — that one covers the case, this one covers the shape.
The thesis, in one line: a fan product database is not a spreadsheet with more columns — it is a structured engineering model of the range.
Start with the hierarchy, not the parameter list
The first mistake is opening a table and typing column headings. Before any attribute is defined, the range needs a skeleton, because where a value lives determines whether it can be maintained.
The level that gets skipped most often is the series. In spreadsheets, "series" is usually just text repeated in a column — ABC, ABC, ABC, four hundred times. That works until the series description changes and you discover it exists in four hundred places, in three languages.
A series is an object. It owns the things that are true for every size in it: the aerodynamic family, the casing construction, the marketing description, the installation manual, the certificates that cover the whole range. A model then owns what changes with wheel size, and a variant owns what changes with the order.
Decide which level each attribute belongs to
This is the decision that quietly determines how much manual work the database creates for the next decade, and it is almost always made by accident. Put an attribute too low and you maintain the same value hundreds of times. Put it too high and you cannot express a real product difference without inventing a new series.
| Level | Holds | Examples |
|---|---|---|
| Category | Classification and defaults | Fan type, application area, which attribute set applies |
| Series | Everything shared by all sizes | Description, casing material, blade type, manual, series certificates |
| Model | Everything that scales with size | Wheel diameter, dimensions, weight, connection sizes, performance curves |
| Variant | Everything chosen when ordering | Motor power, voltage, pole count, drive type, coating, accessories |
A practical test: if changing a value would require editing more than one row, it is sitting at the wrong level. "Blade type: backward-curved" repeated across 40 models belongs to the series. Motor power repeated across every model in a series belongs to the variant, not the model — otherwise a customer asking for the same fan with a different motor forces you to duplicate the whole record.
Get this wrong and the fix is not a query — it is a re-import.
Store values, not formatted text
The most common damage in migrated data is that engineering values arrive as strings.
Qmax = "12 500 m³/h" is a label. It cannot be filtered, sorted, converted or compared, because to a database it is prose that happens to contain digits. The same value written by four people becomes 12,500 m3/h, 12500 m³/h, 3.47 m³/s and 3472 l/s — four different strings describing one fan.
Store the number and the unit separately, and pick one canonical unit per quantity:
| Quantity | Canonical unit |
|---|---|
| Airflow | m³/h |
| Pressure | Pa |
| Power | W |
| Rotational speed | rpm |
| Dimensions | mm |
| Sound power level | dB re 10⁻¹² W |
Convert on the way in and on the way out, never in storage. A customer in the United States should see cfm and in. w.g. because the interface converts for them, not because a second set of columns exists holding imperial duplicates that will drift out of step with the metric ones. Our unit converter covers the conversions themselves; the point here is that they belong at the edges of the system.
Separate product attributes from performance data
A fan has attributes — one diameter, one weight, one connection size. It also has performance, which is not an attribute at all. It is a dataset.
Flattening a curve into columns is where most spreadsheet-based ranges break down. Qmax and pressure_at_max describe two points on something that has dozens, and they say nothing about what happens between them, which is exactly where every real duty point sits.
Structurally, that means a second table hanging off the model, with its own conditions attached:
| Product attributes | Performance dataset |
|---|---|
| One row per model | Many rows per model |
| Diameter 400 mm | Airflow / pressure / power / efficiency points |
| Weight 38 kg | Valid at a stated speed |
| Inlet 400 mm | Valid at a stated air density |
| Blade type backward-curved | Measured to a stated test standard and installation type |
Those last three rows are not bookkeeping. A curve without its speed cannot be scaled with the fan laws. A curve without its air density cannot be corrected for altitude or temperature. A curve without its installation category cannot be honestly compared against a competitor's. Data that omits them is not portable, and the omission is invisible until someone tries to use it.
Store curves as data, not as pictures
Plenty of manufacturers do hold their curves — as PNGs exported from a plotting tool, one per model, sitting in a folder.
A picture can be printed and nothing else. It cannot be interrogated at a duty point, scaled to another speed, corrected to another density, or handed to a selection engine. Every downstream use requires a human to read the graph and retype the number, which reintroduces exactly the drift the database was supposed to eliminate.
Stored as rows, the same curve drives the online catalogue, the generated datasheet, the API response and the operating point a customer solves for — all from one record. The image, if you still want one, becomes an output rather than the source.
Give acoustic data the same treatment
"Noise: 72 dB" is the acoustic equivalent of storing a curve as a picture. It compresses a spectrum into a single number and discards the context that makes the number meaningful.
The record needs the eight octave-band levels, and alongside them: which radiation path it describes (inlet, outlet or casing), the duty point it was measured at, the weighting, and the test method. Different paths are different data and cannot substitute for one another — a point we work through in detail in sound power vs sound pressure and octave bands.
The structural consequence is the same as for curves: acoustics is a child dataset with its own conditions, not a column on the product row.
Write validation rules before you import
At 5,000 products, nobody reviews the data by reading it. The database has to reject what cannot be true.
Three kinds of rule are worth having from day one:
- Range — a diameter of 4,000 mm on a duct fan, a negative shaft power, zero rpm, a mains voltage of 2,300 V. Cheap to check, and they catch decimal-point and unit-entry errors.
- Relationship — Qmax below Qmin; an efficiency above 100%; a duty point outside the curve it belongs to; a model whose curve implies more shaft power than its motor can deliver.
- Completeness — a model with a performance curve but no motor data, a variant with no price, a series published with no description in a language the catalogue is offered in.
Completeness rules are the ones that pay for themselves. They turn "the catalogue is finished" from an opinion into a query.
Design for bulk editing, not record-by-record
Return to the opening scenario. Qmax has changed for 120 models. In a system built around a product form, that is 120 rounds of open, edit, save, next — an afternoon of work with a realistic chance of a typo, and no way to review what was actually changed.
The requirement is that data can be worked with as a table: filter to the 120 affected models, see the values side by side, paste a column from the spreadsheet the test lab sent, and commit once.
Two things make that safe rather than dangerous. Validation runs on the pasted values before they are committed, so a misaligned paste is caught rather than saved. And every change is recorded with who made it and what it replaced, so a bad bulk edit can be reversed. Bulk editing without an audit trail is just a faster way to corrupt 120 records.
Attach documents to the product, not to a folder
Documentation drifts in a way that is easy to miss, because nothing appears broken. A shared drive accumulates final.pdf, final_2.pdf and final_new_ok.pdf, and the only person who knows which is current is the one who made them.
Files belong to the record they describe, typed by role — datasheet, installation manual, dimensional drawing, CAD, BIM object, declaration of conformity, certificate. Typing matters: it lets the website show only what is public, the datasheet generator pull the drawing it needs, and an export include certificates without a human choosing files by hand.
Attach them at the level they actually apply to. An installation manual usually covers a whole series; a dimensional drawing belongs to the model; a test report belongs to the specific configuration that was tested.
Build it so one change reaches every channel
Everything above serves a single property: the database is the only place a value exists, and every output is generated from it.
When that holds, the opening scenario becomes uneventful. Qmax changes for 120 models in one bulk edit. The catalogue page, the generated PDF, the API response and the selection result all change with it, because none of them stores its own copy. Nobody reissues anything.
When it does not hold, every output is a snapshot taken at a different moment, and keeping them aligned is a permanent manual cost that grows with the range.
Plan for the products you do not sell yet
A model designed strictly around today's fan range will need rebuilding the first time something else is added — dampers, silencers, air handling units, accessories sold separately.
The safeguard is not to anticipate every future product, but to keep the attribute set per category rather than global. If "blade type" is a column on the products table, every damper will carry an empty blade-type field forever. If attributes belong to the category, adding silencers means defining a silencer attribute set, not altering the fan one.
What a complete structure looks like
| Layer | Example |
|---|---|
| Category | Centrifugal fans |
| Series | ABC — description, manual, certificates |
| Model | ABC 400 — 400 mm, 38 kg |
| Variant | 2.2 kW / 400 V / belt drive |
| Performance | Curve points at stated speed and density |
| Acoustic | Octave bands, per path, per duty point |
| Compliance | ErP status, FEI, FEG — computed, not stored |
| Documents | Datasheet, CAD, BIM, certificate |
| Translations | Text fields only; numbers stay language-independent |
| Outputs | Catalogue, PDF, API, selection software |
One row there is easy to misread. Compliance figures are marked computed rather than stored deliberately: FEI, FEG and ErP status are derived from the curve at a duty point under a stated method. Store them as values and they silently go stale the moment a curve is re-measured or a threshold changes in the regulation. Store the inputs and compute on demand.
Five rules worth keeping
- Structure the range before importing anything — hierarchy first, attributes second.
- Decide the level each attribute lives at; the wrong level costs a re-import.
- Store numbers with units, in one canonical unit, converted only at the edges.
- Treat curves and acoustic spectra as datasets with conditions attached, never as columns or pictures.
- Make the database the only copy, so every channel is generated rather than maintained.
Frequently asked questions
Can we not just keep using Excel?
For one series, yes. The limits appear when the same fact exists in more than one place and no rule says which wins — typically at a few hundred products, several languages, or the first time a curve is re-measured. Excel has no concept of a child dataset, so curves and octave-band spectra cannot be represented properly in it.
How long does structuring a range take?
The modelling is quick; the data preparation is not. Where technical data already exists in a consistent form, a range can be structured in weeks. Where it has to be consolidated from mixed sources and curves digitised from documents, that migration work dominates the schedule.
What if our curves only exist as printed charts?
They have to be digitised into point sets before they are of any use to a calculation engine. This is unavoidable work, but it is done once. Scanning the chart into the database as an image simply postpones it.
Should performance data be stored per model or per variant?
Per model, with the conditions attached — the curve is a property of the wheel and its speed. Variants that change the operating speed, such as a different motor or drive ratio, reference the same curve scaled by the fan laws rather than storing a duplicate.
Do we need to store both metric and imperial values?
No, and storing both is actively harmful — two copies of one number drift apart. Store the canonical unit and convert for display.
If you are structuring a fan range rather than maintaining a spreadsheet of it, this is the shape the data needs to take. It is also what our product information management platform is built around — categories, series, models and variants, with curves, acoustic spectra, documents and translations attached where they belong, feeding the catalogue, datasheets, API and fan selection software from one record.