
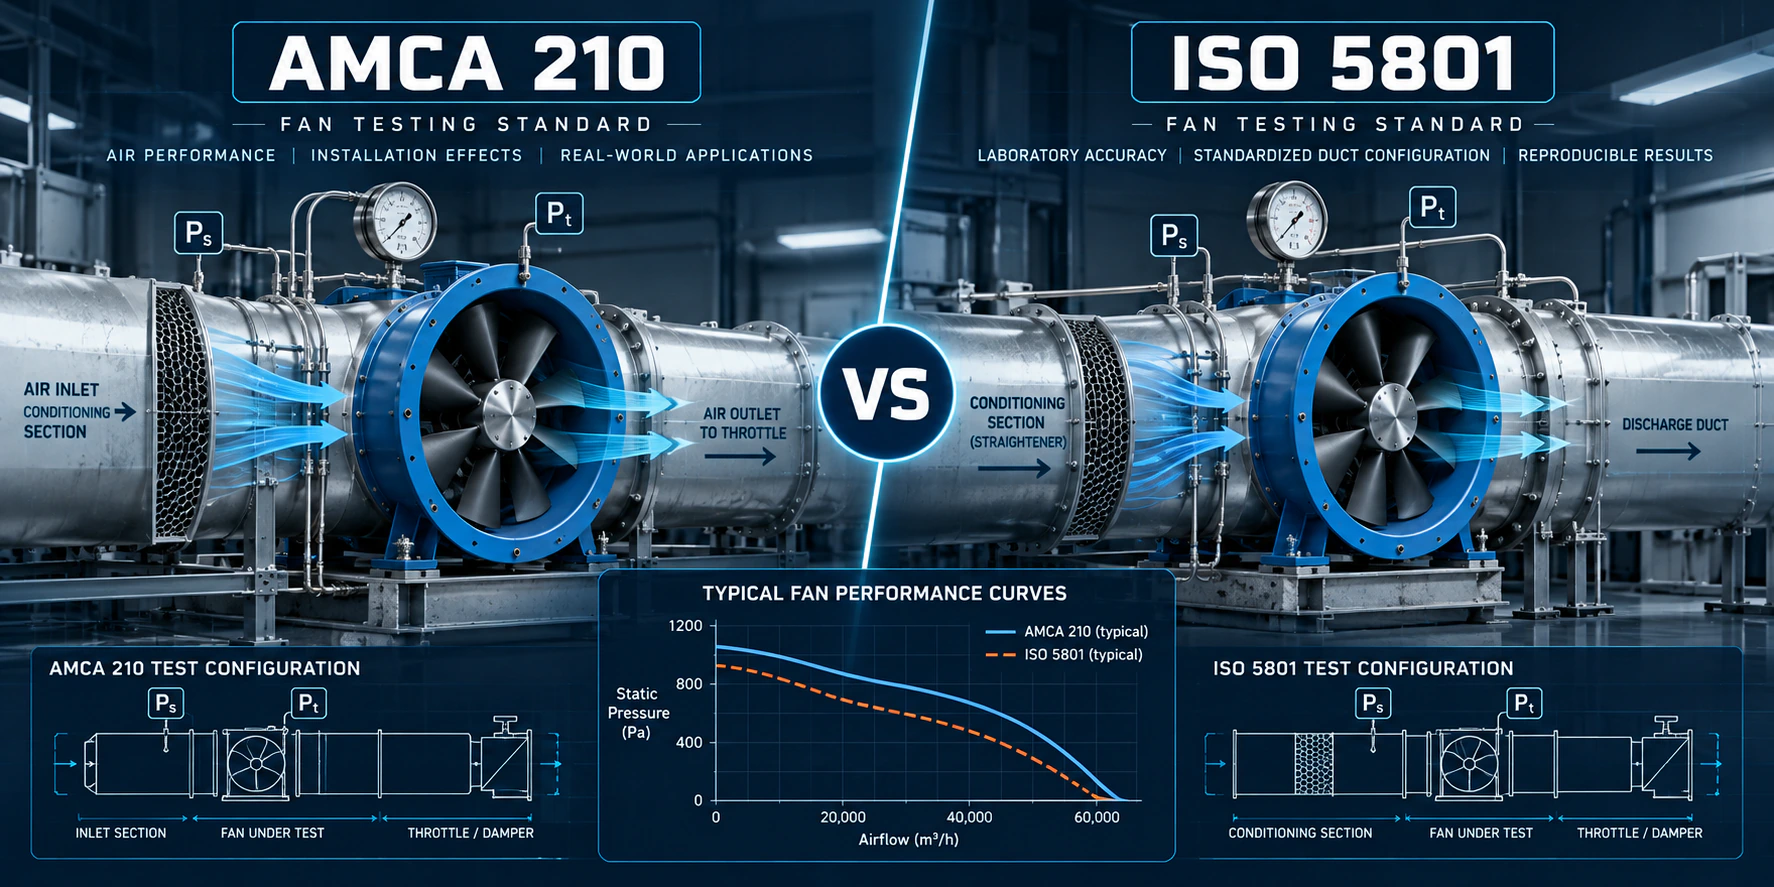
Two centrifugal fans, same wheel diameter, same claimed duty point — and one manufacturer's curve shows 15% more pressure at the same airflow than the other's. Before concluding one impeller is aerodynamically better, check something more basic first: were they tested the same way? A fan curve is only as comparable as the test method behind it, and the two dominant methods — ANSI/AMCA 210 and ISO 5801 — agree on the physics but leave real room for numbers to diverge if you don't read the fine print.
This isn't about picking a side. It's about knowing which four or five details on a datasheet actually determine whether two curves can be compared at all.
What each standard actually is
ANSI/AMCA 210 — Laboratory Methods of Testing Fans for Certified Aerodynamic Performance Rating — is published by AMCA International (Air Movement and Control Association), a North American industry body that also runs the AMCA Certified Ratings Program. AMCA 210 is the test method; AMCA Certification is a separate, ongoing verification program layered on top of it. A fan "tested to AMCA 210" and a fan "AMCA Certified" are not the same claim — certification means an independent, periodic check that production units still match the published curve, and only certified products can carry the AMCA seal.
ISO 5801 — Fans — Performance testing using standardized airways — is the international equivalent, maintained by ISO and the reference most manufacturer curves outside North America are built on. ISO doesn't run its own certification program the way AMCA does; conformance is typically demonstrated through accredited third-party test labs instead.
Both standards measure the same core quantities — volume flow, pressure rise, rotational speed, power input and efficiency — using the same underlying aerodynamic principles (they've been progressively harmonized over successive revisions). The numbers they produce for the same physical fan are close. Where they stop being comparable is when the installation category or the pressure convention differs between two curves you're putting side by side.
Installation type is the detail everyone skips
A fan's measured airflow and pressure depend heavily on what's connected to its inlet and outlet during the test — not just the impeller inside it. Both standards define the same four configurations, conventionally labelled Type A through D:
| Type | Inlet | Outlet | Represents |
|---|---|---|---|
| A | Free | Free | Standalone fan, no ducting either side |
| B | Free | Ducted | Typical supply-air arrangement |
| C | Ducted | Free | Typical exhaust arrangement |
| D | Ducted | Ducted | Most real industrial/HVAC installations |
A fan tested Type A (free inlet, free outlet — the easiest, most flattering configuration) will show a different curve than the same fan tested Type D, purely from the aerodynamic effect of the connected ductwork on how air enters and leaves the impeller — before you've even installed it in a real duct run. Comparing a Type A curve from one manufacturer against a Type D curve from another is comparing two different measurements, not two different fans.
This is also exactly why a manufacturer's laboratory curve and your fan's actual installed performance can differ even when the lab curve is completely accurate: your real ductwork configuration around the fan almost never matches the idealized test setup, and the gap between them is quantified as system effect. If you're comparing a catalog curve to field performance (or specifying a fan based on a Type A rating for what will actually be a heavily ducted Type D installation), run the installation through the system effect calculator (AMCA 201) before assuming the discrepancy is a bad fan rather than an unaccounted installation effect.
Static pressure vs. total pressure — the other silent variable
The second most common source of "different numbers, same fan" is a pressure-convention mismatch: static pressure and total pressure are not interchangeable, and the gap between them (velocity pressure) grows with outlet velocity. Two labs measuring the identical fan, one reporting static and one reporting total, will publish two different pressure figures for the same physical performance. We cover the full derivation and when each convention applies in static pressure vs. total pressure, explained — worth reading alongside this one if you're reconciling curves from different sources.
Air density — the correction both standards require, and both leave to you
Every certified fan curve is referenced to a stated air density (commonly 1.2 kg/m³, corresponding to standard conditions). Both AMCA 210 and ISO 5801 require the test density to be stated and corrected to the reference condition — but neither standard corrects your installation's actual operating density for you. If you're applying a catalog curve at altitude, at elevated temperature, or to a gas other than standard air, that correction is a separate step you run yourself; see our fan density-correction walkthrough in the high-temperature fan selection guide for the worked arithmetic, and check your specific case with the air density calculator.
AMCA 210 vs. ISO 5801, side by side
| ANSI/AMCA 210 | ISO 5801 | |
|---|---|---|
| Publishing body | AMCA International | International Organization for Standardization |
| Primary region | North America | International — dominant in Europe, Asia, Middle East |
| Ongoing certification program | Yes — AMCA Certified Ratings Program | No certification body of its own; conformance shown via accredited labs |
| Installation categories | Type A–D | Type A–D (equivalent definitions) |
| Core quantities measured | Flow, pressure, power, speed, efficiency | Flow, pressure, power, speed, efficiency |
In practice, most global manufacturers test to both — either directly, or through labs accredited for both frameworks — precisely because their customers span both regulatory environments. Seeing "tested per AMCA 210 and ISO 5801" on a datasheet is normal, not a red flag.
Can you compare an AMCA-tested curve to an ISO-tested curve?
Cautiously, yes — provided the following all match between the two curves:
- same installation type (A/B/C/D)
- same pressure convention (static or total)
- same reference air density, or both explicitly corrected to it
- testing performed by an accredited lab in both cases
If any one of those differs, you're not comparing fan performance — you're comparing test conditions. Recompute both curves onto a common operating point (same actual flow, same actual density) using the fan operating point calculator before drawing a conclusion, rather than reading two data sheets side by side and trusting the raw numbers.
Which standard should you specify?
As a starting point: AMCA 210 (often with AMCA Certification specifically called out) for North American projects, ISO 5801 for European, Middle Eastern, Asian and most other international work. But the standard's name matters less than what's actually behind it — a fan "tested to ISO 5801, Type A, free inlet/outlet" gives you enough information to know exactly what you're looking at; "meets ISO 5801" without installation type or pressure basis doesn't, regardless of which standard's name is printed on the sheet.
A practical checklist before you compare two fan curves
- Same installation type (A, B, C or D) on both curves?
- Same pressure convention — static or total?
- Same reference air density, or corrected to a common one?
- Tested (not just designed to) the stated standard, ideally by an accredited lab?
- If one is AMCA Certified, is the comparison fan certified too, or only "tested"?
If you can tick all five, the comparison is meaningful. If you can't answer one of them from the datasheet, ask the manufacturer before you specify — the standard's name on the cover page is the least informative part of the comparison.
Conclusion
ANSI/AMCA 210 and ISO 5801 measure the same physics and, for a well-documented fan, produce closely comparable results. The differences that actually matter in practice — installation type, pressure convention, reference density, and whether a fan is merely tested versus formally certified — sit inside the standard, not between the two standards. Read those details before comparing curves, and a lot of "this fan underperforms its rating" investigations turn out to be "this fan was compared against the wrong installation type" instead.